A/B Testing, Dynamic MAB, and Causal Inference for In-Game Revenue
Association:
iSchool, University of Toronto
Duration:
2 months
Data Science
Statistics
Python

Background
This project focuses on a multiplayer online battle arena (MOBA) mobile game played globally by adolescents and young adults aged 15–35. The game is available on both iOS and Android platforms. The goal is to simulate randomized control trials (RCTs) to assess the impact of various experimental treatments on user engagement, retention, and monetization metrics.
Problem Statement
This study investigates whether offering a timed free trial of in-game items significantly impacts the amount of money players spend in the game. It is commonly believed that limited-time previews of premium features can lead to subsequent purchases. Consequently, players who receive free trials may spend more than those who do not.
Parallel Design
In this experiment, a random selection of users will receive a free trial promotion for an in-game skin item that enhances their character's power. League classification is used as a blocking factor to control for potential differences in spending behavior based on in-game proficiency. Advanced and professional players are likely to spend more on premium items compared to casual users. Additionally, income levels and daily playtime are considered as covariates. Income level can indicate a user's purchasing power, while playtime reflects their engagement and commitment to the game, both of which can influence spending habits. People with higher incomes might have a higher ability to purchase add-on items; likewise, more active players might be willing to invest in the game more. The average amount spent on in-game purchases will be compared between groups using the ANCOVA methodology.
# Define the blocking factor
blocking_factor = 'League'

# Subset data for the parallel RCT analysis
parallel_data = df[['Free_Trial', 'CT_Purchase_Amount', 'TM_Purchase_Amount', blocking_factor, 'Income', 'CT_Playtime','TM_Playtime']]

# Randomly select 100 observations per block, split evenly between trial groups
sampled_data = parallel_data.groupby([blocking_factor], group_keys=False).apply(
    lambda x: x.groupby('Free_Trial').sample(n=50, random_state=42)  # 50 per trial group within each block
)

# Create the new 'Purchase_Amount' column
sampled_data['Purchase_Amount'] = sampled_data.apply(
    lambda row: row['CT_Purchase_Amount'] if row['Free_Trial'] == 'No' else row['TM_Purchase_Amount'],
    axis=1
)

# Create the new 'Playtime' column
sampled_data['Playtime'] = sampled_data.apply(
    lambda row: row['CT_Playtime'] if row['Free_Trial'] == 'No' else row['TM_Playtime'],
    axis=1
)

# Save the new DataFrame with the selected observations
df_parallel = sampled_data[['Free_Trial', 'Purchase_Amount', blocking_factor, 'Income', 'Playtime']].reset_index(drop=True)  # Reset index for a clean DataFrame

# Convert Free_Trial to numeric in the subset DataFrame
df_parallel['Free_Trial'] = (df_parallel['Free_Trial'] == 'Yes').astype(int)

# Run the two-way ANOVA with blocking factor and covariates
def run_two_way_anova(data):
    # Fit the model
    model = ols('Purchase_Amount ~ C(Free_Trial) + C(League) + C(Free_Trial):C(League) + Income + Playtime',
                data=data).fit()

    # Generate ANOVA table
    anova_table = sm.stats.anova_lm(model, typ=2)

    # Print results
    print("\nANOVA Table:")
    print(anova_table)
    print("\nModel Summary:")
    print(model.summary())

    return model, anova_table

# Run the analysis on the subset DataFrame
model, anova_table = run_two_way_anova(df_parallel)

# Post-hoc tests for Free_Trial (if significant)
if anova_table.loc['C(Free_Trial)', 'PR(>F)'] < 0.05:
    print("\nPost-hoc Test for Free_Trial:")
    group_yes = df_parallel[df_parallel['Free_Trial'] == 1]['Purchase_Amount']
    group_no = df_parallel[df_parallel['Free_Trial'] == 0]['Purchase_Amount']
    t_stat, p_value = ttest_ind(group_yes, group_no)
    print(f"T-statistic: {t_stat}, p-value: {p_value}")

# Post-hoc tests for League (if significant)
if anova_table.loc['C(League)', 'PR(>F)'] < 0.05:
    print("\nPost-hoc Test for League:")
    tukey = pairwise_tukeyhsd(endog=df_parallel['Purchase_Amount'],
                              groups=df_parallel['League'],
                              alpha=0.05)
    print(tukey)

# Post-hoc tests for Interaction (if significant)
if anova_table.loc['C(Free_Trial):C(League)', 'PR(>F)'] < 0.05:
    print("\nPost-hoc Test for Interaction:")
    mc = MultiComparison(df_parallel['Purchase_Amount'],
                         groups=df_parallel['Free_Trial'].astype(str) + " - " + df_parallel['League'])
    results = mc.tukeyhsd(alpha=0.05)
    print(results)

    # Interaction plot
    sns.pointplot(x='League', y='Purchase_Amount', hue='Free_Trial', data=df_parallel, ci=95)
    plt.title('Interaction Plot: Free_Trial vs. League')
    plt.show()
Results & Discussions
Free Trial significantly increases spending – users who received a trial spent ~$20.5 more.
League has no impact on spending – No significant difference across leagues.
No interaction effect – Free Trial works similarly across all leagues.
Income has no impact on spending – No significant difference across income levels..
Playtime does not influence spending.
Model fit is weak – suggesting other factors might be more predictive.

The parallel experiment has supported the statistically significant effects of free trial promotion. In other words, receiving a timed free trial of in-game items has a significant effect on the amount of money a player spends in the game, which aligns with the conventional belief that having a limited-time preview of premium features leads to a subsequent purchase of the item. As a result, gamers receiving free trials might spend more than non-promo gamers. Thus, free trial promotion is considered to be an effective strategy to boost revenue for the game. However, the experiments cannot find evidence to support the difference in purchase amount between League or Income groups, even after accounting for the effect of the daily minutes that the gamers play.
Multi-Arm Bandit (MAB)
The MAB experiment is designed to optimize monetization strategies in gaming by testing the impact of free trials on player purchase behavior. Using Thompson sampling methodology, we compared four different variants of our trial strategy to identify which approach maximizes player spending with minimal opportunity cost. The model determines success by measuring both conversion rates and purchase amounts. Conversion denotes a participant who made a purchase, and the purchase amount measures the dollar amount they spent.
def run_mab_experiment(df, variants, initial_samples, total_samples, min_samples_threshold, max_iterations):
    # Initialize variant states
    variant_states = {
        variant: {
            'samples': initial_samples,
            'successes': 0,
            'failures': 0,
            'active': True,
            'eliminated_at': None,
            'history': [initial_samples],
            'purchase_amounts': []
        } for variant in variants
    }

    # Prepare variant-specific dataframes
    variant_dfs = {}
    for variant in variants:
        variant_letter = variant.split('_')[-1]
        if variant_letter == 'A':
            variant_dfs[variant] = df[df['Free_Trial'] == 'No'].copy() # Base performance
        elif variant_letter == 'B':
            variant_dfs[variant] = df[df['Free_Trial'] == 'Yes'].copy() # Treatment 1
        elif variant_letter == 'C': # Treatment 2
            combined = pd.concat([
                df[df['Free_Trial'] == 'No'].sample(frac=0.5, random_state=42),
                df[df['Free_Trial'] == 'Yes'].sample(frac=0.5, random_state=42)
            ])
            combined['Purchase_Amount'] *= 1.1
            variant_dfs[variant] = combined
        elif variant_letter == 'D': # Treatment 3
            combined = pd.concat([
                df[df['Free_Trial'] == 'No'].sample(frac=0.3, random_state=42),
                df[df['Free_Trial'] == 'Yes'].sample(frac=0.7, random_state=42)
            ])
            combined['Purchase_Amount'] *= 1.05
            variant_dfs[variant] = combined

    # Print initial conversion rates
    print("Initial conversion rates:")
    for variant in variants:
        df_variant = variant_dfs[variant]
        conv_rate = (df_variant['Purchase_Amount'] > 0).mean()
        avg_purchase = df_variant.loc[df_variant['Purchase_Amount'] > 0, 'Purchase_Amount'].mean()
        print(f"{variant}: Conversion rate: {conv_rate:.4f}, Avg purchase: ${avg_purchase:.2f}")

    # Run the MAB experiment
    min_iterations_before_elimination = 5 # Minimum iterations before allowing eliminations
    redistribution_percentage = 0.8 # 80% of observations will be allocated from losing to winning variants

    for iteration in range(1, max_iterations + 1):
        # Simulate outcomes for active variants
        for variant in variants:
            if variant_states[variant]['active']:
                current_samples = variant_states[variant]['samples']
                indices = np.random.choice(variant_dfs[variant].index, size=current_samples, replace=True)
                sampled_data = variant_dfs[variant].loc[indices]
                successes = (sampled_data['Purchase_Amount'] > 0).sum()
                failures = current_samples - successes
                variant_states[variant]['successes'] += successes
                variant_states[variant]['failures'] += failures
                variant_states[variant]['purchase_amounts'].extend(sampled_data['Purchase_Amount'].tolist())

        # Skip redistribution if only one variant remains
        active_variants = [v for v in variants if variant_states[v]['active']]
        if len(active_variants) <= 1:
            for variant in variants:
                variant_states[variant]['history'].append(variant_states[variant]['samples'])
            continue

        # Calculate Thompson sampling scores
        performance = {}
        for variant in active_variants:
            alpha = variant_states[variant]['successes'] + 1
            beta_param = variant_states[variant]['failures'] + 1
            conversion_rate = beta.rvs(alpha, beta_param)
            purchase_amounts = [amt for amt in variant_states[variant]['purchase_amounts'] if amt > 0]
            avg_purchase = np.mean(purchase_amounts) if purchase_amounts else 0
            performance[variant] = {'avg_purchase': avg_purchase}

        # Rank variants by average purchase amount
        ranked_variants = sorted(active_variants, key=lambda v: performance[v]['avg_purchase'], reverse=True)

        # Eliminate worst variant if conditions are met
        worst_variant = ranked_variants[-1]
        worst_samples = variant_states[worst_variant]['samples']
        if (iteration >= min_iterations_before_elimination and
            worst_samples <= min_samples_threshold and
            variant_states[worst_variant]['active']):
            variant_states[worst_variant]['active'] = False
            variant_states[worst_variant]['eliminated_at'] = iteration
            print(f"Iteration {iteration}: {worst_variant} eliminated")
            ranked_variants.remove(worst_variant)

        # Redistribution logic
        samples_to_redistribute = int(redistribution_percentage * worst_samples) if variant_states[worst_variant]['active'] else worst_samples
        new_allocations = {v: variant_states[v]['samples'] for v in variants}
        new_allocations[worst_variant] -= samples_to_redistribute

        if len(ranked_variants) >= 3:
            # 50% to 1st, 30% to 2nd, 20% to 3rd
            new_allocations[ranked_variants[0]] += int(0.5 * samples_to_redistribute)
            new_allocations[ranked_variants[1]] += int(0.3 * samples_to_redistribute)
            new_allocations[ranked_variants[2]] += int(0.2 * samples_to_redistribute)

            # Handle any rounding errors by adding to the top variant
            remainder = samples_to_redistribute - (int(0.5 * samples_to_redistribute) +
                                                  int(0.3 * samples_to_redistribute) +
                                                  int(0.2 * samples_to_redistribute))
            new_allocations[ranked_variants[0]] += remainder

        elif len(ranked_variants) == 2:
            # 60% to 1st, 40% to 2nd
            new_allocations[ranked_variants[0]] += int(0.6 * samples_to_redistribute)
            new_allocations[ranked_variants[1]] += int(0.4 * samples_to_redistribute)

            # Handle any rounding errors
            remainder = samples_to_redistribute - (int(0.6 * samples_to_redistribute) +
                                                  int(0.4 * samples_to_redistribute))
            new_allocations[ranked_variants[0]] += remainder

        elif len(ranked_variants) == 1:
            # If only one left, it gets everything
            new_allocations[ranked_variants[0]] += samples_to_redistribute

        # Ensure total sample count remains fixed
        total_current_samples = sum(new_allocations.values())
        correction_factor = total_samples / total_current_samples if total_current_samples > 0 else 1
        for v in variants:
            new_allocations[v] = max(1, int(new_allocations[v] * correction_factor)) if variant_states[v]['active'] else 0
            variant_states[v]['samples'] = new_allocations[v]
            variant_states[v]['history'].append(new_allocations[v])

        # Terminate if only one variant remains
        if sum(1 for v in variants if variant_states[v]['active']) <= 1:
            print(f"Terminating at iteration {iteration}: Only one active variant remains")
            break

    # Calculate final metrics
    results = {
        'sample_allocation': {variant: variant_states[variant]['history'] for variant in variants},
        'final_allocation': {variant: variant_states[variant]['samples'] for variant in variants},
        'active_status': {variant: variant_states[variant]['active'] for variant in variants},
        'eliminated_at': {variant: variant_states[variant]['eliminated_at'] for variant in variants},
        'conversion_metrics': {
            variant: {
                'conversion_rate': variant_states[variant]['successes'] / (variant_states[variant]['successes'] + variant_states[variant]['failures']),
                'average_purchase': np.mean([amt for amt in variant_states[variant]['purchase_amounts'] if amt > 0]) if variant_states[variant]['purchase_amounts'] else 0,
                'total_conversions': variant_states[variant]['successes'],
                'purchase_amounts': variant_states[variant]['purchase_amounts']
            } for variant in variants
        }
    }
    return results

def create_mab_data(size=1000):
    np.random.seed(42)
    df = pd.DataFrame({
        'Free_Trial': np.random.choice(['Yes', 'No'], size=size),
        'CT_Purchase_Amount': np.where(np.random.random(size) < 0.15, np.random.normal(50, 15, size), 0), # Higher conversion rate but lower purchase amount
        'TM_Purchase_Amount': np.where(np.random.random(size) < 0.10, np.random.normal(75, 20, size), 0) # Lower initial conversion rate but higher purchase amount
    })
    df['Purchase_Amount'] = df.apply(lambda row: row['CT_Purchase_Amount'] if row['Free_Trial'] == 'No' else row['TM_Purchase_Amount'], axis=1)
    return df

def visualize_mab_redistribution(results, variants, min_samples_threshold):
    plt.figure(figsize=(14, 10))

    # Create subplots for better organization
    gs = plt.GridSpec(2, 1, height_ratios=[3, 1])

    # Top plot - Sample allocation over iterations
    ax1 = plt.subplot(gs[0])
    ax1.set_ylabel('Number of Assignments', fontsize=12)
    ax1.set_title('MAB: Variant Assignments and Purchase Amount Evolution', fontsize=14)

    # Plot the number of assignments for each variant
    colors = plt.cm.tab10(np.linspace(0, 1, len(variants)))
    for i, variant in enumerate(variants):
        ax1.plot(results['sample_allocation'][variant],
                 label=f"{variant}",
                 color=colors[i],
                 linestyle='-', marker='o', markersize=4)

    # Add elimination threshold
    ax1.axhline(y=min_samples_threshold, color='gray', linestyle='--', alpha=0.7,
                label='Elimination Threshold')

    # Add annotations for eliminated variants
    for variant in variants:
        if results['eliminated_at'][variant] is not None:
            elim_iter = results['eliminated_at'][variant]
            if elim_iter < len(results['sample_allocation'][variant]):
                ax1.annotate(f"{variant} eliminated",
                            xy=(elim_iter, results['sample_allocation'][variant][elim_iter]),
                            xytext=(elim_iter, results['sample_allocation'][variant][elim_iter] + 100),
                            arrowprops=dict(facecolor='black', shrink=0.05, width=0.5),
                            fontsize=10)

    ax1.grid(True, linestyle='--', alpha=0.7)

    # Bottom plot - Average purchase amount evolution
    ax2 = plt.subplot(gs[1])
    ax2.set_xlabel('Iterations', fontsize=12)
    ax2.set_ylabel('Avg Purchase ($)', fontsize=12)

    # Calculate evolving average purchase for each variant
    for i, variant in enumerate(variants):
        # Calculate running average of purchase amounts
        purchase_amts = np.array(results['conversion_metrics'][variant]['purchase_amounts'])
        if len(purchase_amts) > 0:
            # Calculate running averages
            running_avg = []
            for j in range(1, len(results['sample_allocation'][variant])):
                slice_size = sum(results['sample_allocation'][variant][:j])
                # Ensure we don't exceed available data
                valid_slice = min(slice_size, len(purchase_amts))
                # Filter only positive purchase amounts
                valid_purchases = [amt for amt in purchase_amts[:valid_slice] if amt > 0]
                if valid_purchases:
                    running_avg.append(np.mean(valid_purchases))
                else:
                    running_avg.append(0)

            # Plot running average purchase amount
            ax2.plot(range(1, len(results['sample_allocation'][variant])), running_avg,
                    label=f"{variant} (Final ${results['conversion_metrics'][variant]['average_purchase']:.2f})",
                    color=colors[i], linestyle='-', marker='s', markersize=3)

    # Highlight the winning variant
    final_metrics = [(v, results['conversion_metrics'][v]['average_purchase'])
                     for v in variants if results['active_status'][v]]
    if final_metrics:
        winning_variant, winning_avg = max(final_metrics, key=lambda x: x[1])
        winner_idx = variants.index(winning_variant)
        ax2.text(len(results['sample_allocation'][variants[0]])*0.8,
                 winning_avg*1.05,
                 f"WINNER: {winning_variant}\n${winning_avg:.2f} avg purchase",
                 fontsize=12,
                 bbox=dict(facecolor='lightyellow', alpha=0.7, boxstyle='round,pad=0.5'))

    ax2.grid(True, linestyle='--', alpha=0.7)

    # Add legends
    ax1.legend(loc='upper left', fontsize=10)
    ax2.legend(loc='lower right', fontsize=10)

    plt.tight_layout()
    plt.show()

    # Print final metrics table
    print("\nFinal Metrics Summary:")
    metrics_df = pd.DataFrame({
        'Variant': variants,
        'Status': ['Active' if results['active_status'][v] else 'Eliminated' for v in variants],
        'Eliminated At': [results['eliminated_at'][v] if results['eliminated_at'][v] else 'N/A' for v in variants],
        'Conversion Rate': [results['conversion_metrics'][v]['conversion_rate'] for v in variants],
        'Avg Purchase': [f"${results['conversion_metrics'][v]['average_purchase']:.2f}" for v in variants],
        'Total Conversions': [results['conversion_metrics'][v]['total_conversions'] for v in variants],
        'Final Allocation': [results['final_allocation'][v] for v in variants]
    })
    print(metrics_df.to_string(index=False))

def run_full_mab():
    df = create_mab_data(size=2000)
    variants = ['NoFreeTrial_A', 'SkinTrial_B', 'WeaponTrial_C', 'HeroTrial_D']

    results = run_mab_experiment(df, variants,
                                initial_samples=25, # Number of initial samples per variant
                                total_samples=100, # Total samples to maintain across all variants / iteration
                                min_samples_threshold=10, # 10% threshold (of 100) to keep a variant active
                                max_iterations=20) # Maximum number of iterations to run

    visualize_mab_redistribution(results, variants, min_samples_threshold=50)
    return results, df

# Run the experiment with the new redistribution rules
results, df = run_full_mab()

def display_allocation_table(results, variants):
    # Create a DataFrame to show sample allocation over iterations
    allocation_data = {variant: results['sample_allocation'][variant] for variant in variants}
    allocation_df = pd.DataFrame(allocation_data)

    # Add a column for iterations
    allocation_df['Iteration'] = range(1, len(allocation_df) + 1)

    # Set 'Iteration' as the index and transpose the DataFrame
    allocation_df.set_index('Iteration', inplace=True)
    allocation_df = allocation_df.T  # Transpose the DataFrame

    # Display the table
    print("Sample Allocation Over Iterations:")
    print(allocation_df)

display_allocation_table(results, variants=['NoFreeTrial_A', 'SkinTrial_B', 'WeaponTrial_C', 'HeroTrial_D'])
Results & Discussions
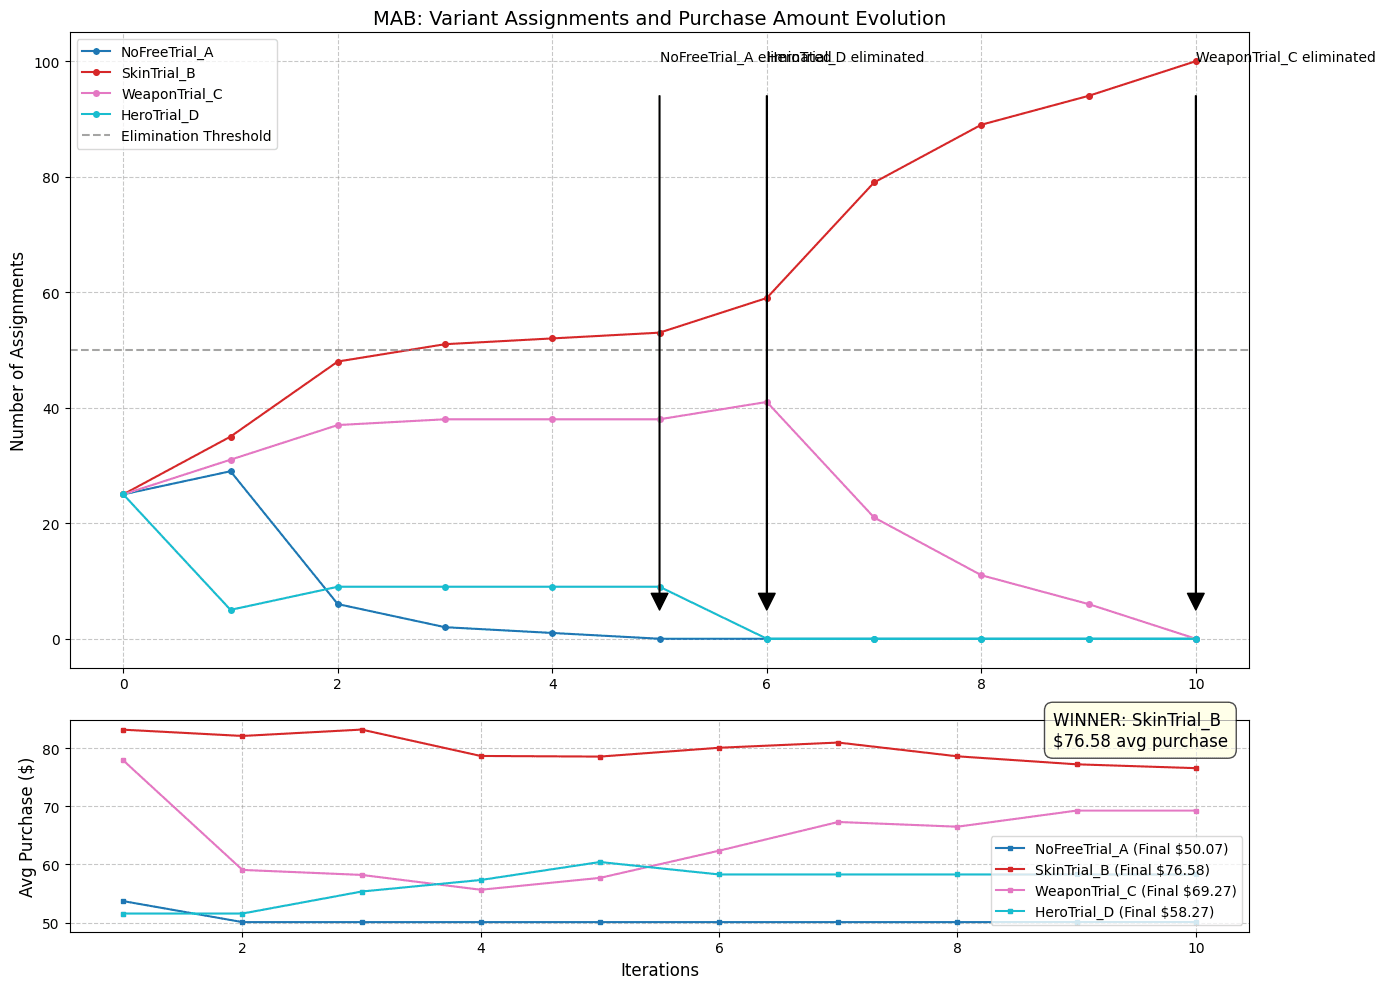
In the initial iteration, the 100 samples were distributed amongst the 4 variants equally (25 samples per variant). Variant A (no free trial) performed the worst and was the first to be eliminated, resulting in no samples in iteration 6. Variant B (skin item trial) performed the best and was the last remaining variant. Out of the maximum of 20 iterations, the model converged after only 11 iterations. This means the model used a total sample size of 1100.
Although some of the variants did switch positions in performance, variant B remained the highest-performing variant throughout the entire model with an average purchase amount of $76.58, which is ~$26 more than users receiving no promotion ($50.07). This aligns with what we have found before that users who received a trial spent ~$20.5 more than those who did not.
The key advantage of MAB over the parallel design is the ability for the MAB to dynamically test multiple variants and adjust resource allocation in real-time to maximize the outcome of the target variable.
Causal Inference
We went one step beyond the mere correlation to identify a true cause-and-effect relationship between free-trial promotion and in-game revenue by establishing a causal model.
# Define treatment, outcome, and confounders
treatment = "Free_Trial"
outcome = "Purchase_Amount"
confounders = ["Income", "Playtime"]

# Build Causal Model
model = CausalModel(
    data=df_parallel,
    treatment=treatment,
    outcome=outcome,
    common_causes=confounders,
    effect_modifiers=["League"]
)

# Visualize DAG
model.view_model()
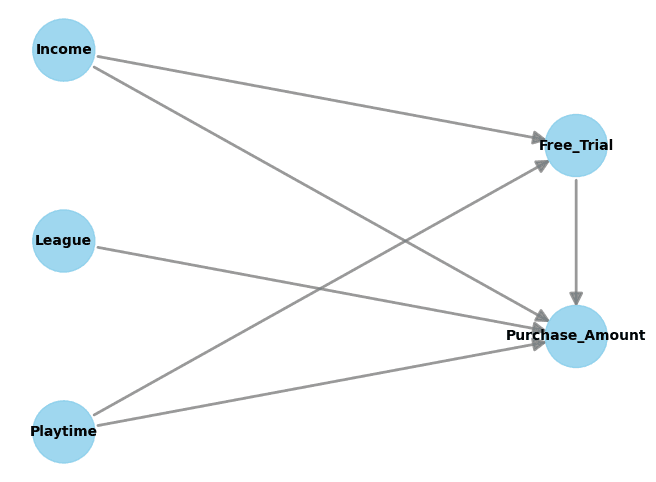
In this model, ‘Income,’ ‘League,’ and ‘Playtime’ are latent variables. ‘Free_Trial’ is the input, and ‘Purchase_Amount’ is the estimand. Meanwhile, ‘League’ is treated as an effect modifier; the effect of ‘Free_Trial’ on the ‘Purchase_Amount’ may vary depending on the player’s league ranking, but the ranking itself does not affect the likelihood of receiving a free trial. ‘Income’ and ‘Playtime’ are covariates accounting for confounding factors that might affect spending.
# Identify the causal estimand
estimand = model.identify_effect()
print("\nIdentified Estimand:\n", estimand)

# Estimate the effect using regression
estimate = model.estimate_effect(estimand, method_name="backdoor.linear_regression")
print("\nEstimated ATE:", estimate.value)

# Estimate the effect using propensity matching score
estimate_propensity = model.estimate_effect(estimand, method_name="backdoor.propensity_score_matching")
print("\nEstimated ATE using Propensity Score:", estimate_propensity.value)

# Sensitivity analysis with cunterfactual variables
# Check robustness by introducing a latent/unobserved variable.
refute = model.refute_estimate(
    estimand, estimate, method_name="add_unobserved_common_cause"
)
print("\nRefutation with unobserved confounder:\n", refute)
Results & Discussions
Backdoor Estimand is a successful identification with the unconfoundedness assumption, indicating that given Income and Playtime, there are no unobserved confounders that affect both the treatment and the outcome. Besides, IV Estimand and Frontdoor Estimand can’t be found because there is no unmeasured confounding nor additional valid mediator between Free_Trial and Purchase_Amount.
ATE = 16.52 (from regression) means that, on average, receiving the free trial increases Purchase_Amount by $16.52.
ATE = 15.47 (from PSM) means that after matching treated and control groups based on propensity scores, the estimated increase is $15.47.
The two values being close means the findings are consistent.
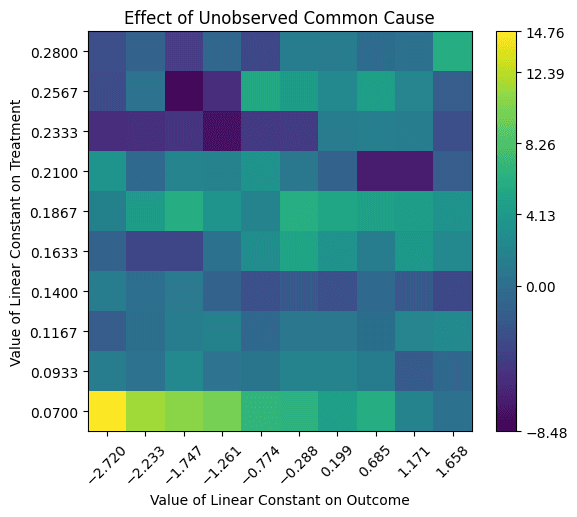
The heatmap shows how the estimated effect changes when introducing an unobserved confounder (U) that influences both Free Trial (Treatment) and Purchase Amount (Outcome). The color indicates the estimated effect under different assumptions of U. Although rare, there are a few scenarios with extremely positive/negative outcomes.
Original estimated effect: 16.52
New effect range (after adding an unobserved confounder): [-8.48, 14.76]
The causal effect changes significantly when including U, ranging from a negative effect (-8.48) to a positive effect (14.76). Since the range includes negative values, it's possible that a Free Trial reduces the Purchase Amount under certain confounding scenarios. Also, the original effect (16.52) lies outside this range, suggesting it may not be robust to unobserved confounding.
The causal inference model directly controls for confounders by using propensity score matching. However, this means that any confounders that are not explicitly included in the causal model will not be accounted for. The randomization of the parallel design model potentially limits the effects of unknown confounders through randomization. If confounders are known, the causal model will generally lead to more robust experiment results than the parallel design model.
Conclusion
Through parallel design, multi-arm bandit, and causal model approaches, this study comprehensively explored the impact of offering timed free trials of in-game items on player spending. The parallel design allowed for a controlled comparison between groups receiving free trials and those who did not, revealing that free trials significantly increased spending by approximately $20.5. The multi-arm bandit experiment, utilizing Thompson sampling, efficiently optimized monetization strategies by identifying the most effective trial variant, which also demonstrated that free trials led to higher average purchase amounts. The causal model further established causation between free trials and in-game revenue, accounting for potential confounders like income and playtime, and consistently estimated the average treatment effect (ATE) through both regression and propensity score matching methods. Future research could explore additional variables and more complex models to better understand and optimize in-game monetization strategies.
Other Projects


© 2026. All rights Reserved.
© 2026. All rights Reserved.